HOW WE CAN HELP
1. CAPTURE
a) Extract data from the automated machines on the shop floor
b) Application to replace paper based data capture
2. STORE
a) Could be on premise or in the cloud basis your specific needs and requirements
b) Needs multiple storage technologies as one size doesn't fit all
3. ANALYSE
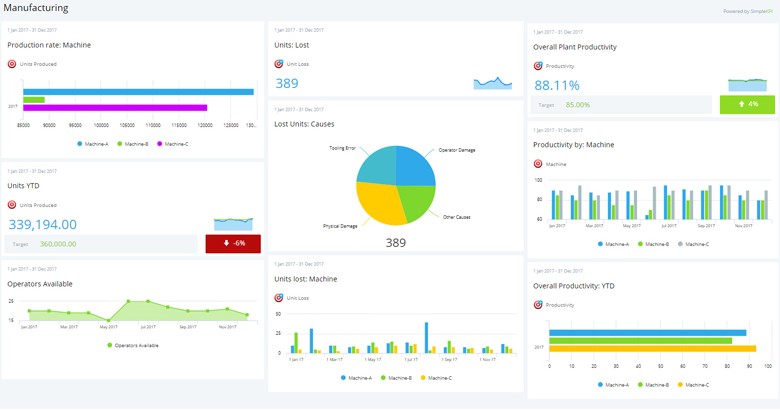
a) KPI Dashboards for actionable insights.
b) AI / ML based analytics with Web Scale to uncover problems before they occur or root cause of issues rather than the symptoms of the problems
Analytics requirements from Customers:
| Type of Analytics | Application of Analytics | What it Provides |
|---|---|---|
| Analysis of Means and Analysis of Variance | Production Comparison of Min, Max, Mean, Standard Deviation across Shifts / Assembly Line / Personnel over a time period |
|
| Frequency Distribution - Normal / Log Normal | Production Distribution Analysis across Shifts |
|
| Correlation / Regression Analysis | Production, Defections, Rejections, Regression Analysis with Personnel Skills / Machine, Shift as explanatory variables. |
|
| Pareto Analysis | Defects / Rejections / Reworks / Downtime Analysis |
|
| Control Charts / Sigma Analysis | Control Charts for Process Outputs for finished component and work in progress |
|